

During my time here at Silverfort, I was tasked with building an alert system to send messages from our Snowflake database directly to a Slack channel. Easy enough, I thought to myself. But the project expanded quickly and has now evolved into a critical component we use daily to monitor and mitigate threats.
In this post, I want to share my journey with you (which started shortly after we transitioned from Redshift to Snowflake), the challenges I faced building this system, and how I was able to overcome them.
The Goal of an Alert System – Helping the Threat-Hunting Team Create Better Value for Customers
Silverfort detects and alerts on breaches to customers by analyzing authentication traffic and information from the environment. Every detection is represented by an Indicator of Compromise (IOC), which can alert us to a variety of things, from simple misconfigurations all the way to potential malicious attacks.
While all this information is readily available in the product, customers may not always understand the meaning behind each IOC. Furthermore, new vulnerabilities and attack methods are constantly being discovered, and this can take time to be fully integrated into the product.
For these reasons, we wanted to create an alert system that would help us easily add new IOC implementations to enable quick and effective investigations into security events.
First Iteration and the Problems it Raised
Snowflake & SnowAlerts
Once we transitioned to using Snowflake as our database for research and analytics work, using it to send alerts about noteworthy security events to a Slack channel seemed like a no-brainer.
Snowflake already has an open-source component calledSnowAlert, developed by the Snowflake team for this exact purpose. Although more streamlined solutions are available as third-party services, because the data in question is sensitive we didn’t want to expose it to any external sources unless necessary. So running this SnowAlert component on a Docker running on an internal machine was a good solution.
(If you want to learn more about the SnowAlert component, a helpful tutorial can be found here:SnowAlert to Slack.)
To send alerts from Snowflake using SnowAlert, these must be placed in a Snowflake View. The view is a saved subquery over a table or another view, which is given a name and can be called in the FROM clause of an SQL query, just like reading from a regular table. You can use views on top of other views, which is a feature I used a lot in building the current iteration of the alert system.
In order for the SnowAlert module to know where to send the desired alerts, the view must be defined with a handler that specifies the template for the message sent, the type of channel (e.g. Slack, email), and the target (e.g. email address, Slack channel, Slack direct message).
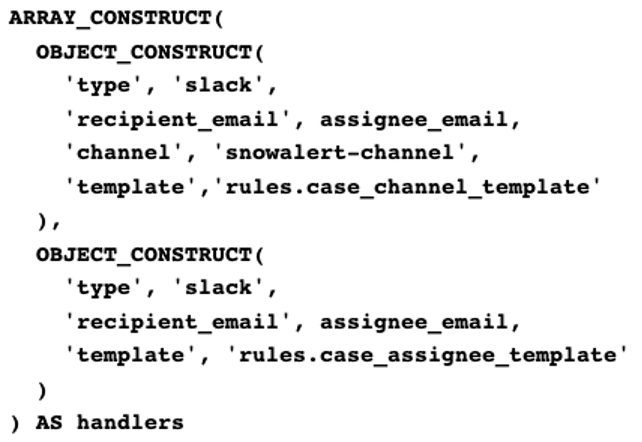
one to a Slack channel and one to a specific email address.
First Implementation
When I was first tasked with building this alert system, we had six different IOCs in mind. All of these could be retrieved from the same Snowflake table and all had a simple logic for detection. I decided to retrieve all the alerts using one query that would scan the table once for the requested dates.
This was done by creating a view of the table to retrieve the alerts and another version of that view to transform it into the format the SnowAlert component required. This worked great for a while…
Problems Faced and What Needed to Change
Once activated, the alert system proved itself over and over by detecting attacks and noteworthy events in our customers’ environments. Building on this success, more IOC detections with varying levels of complexity were added to this system.
We wanted some alerts to be triggered only when certain conditions were met. But some needed to be combined with data from other tables and sources, so join and aggregation operations were needed.
This was quickly becoming a monster, and doing all of this in a single view (basically one SQL query) began to become problematic.
Here are some of the problems we faced:
- As alerts were being added, performing the operations needed on every row all at once was becoming taxing and slow. And the amount of time needed to complete the operation was starting to skyrocket.
- Debugging this giant block of SQL code was a nightmare, and changing and updating it was becoming difficult and prone to errors.
As requests for more IOCs came in, it became clear that a major change in architecture was required.
The current architecture:
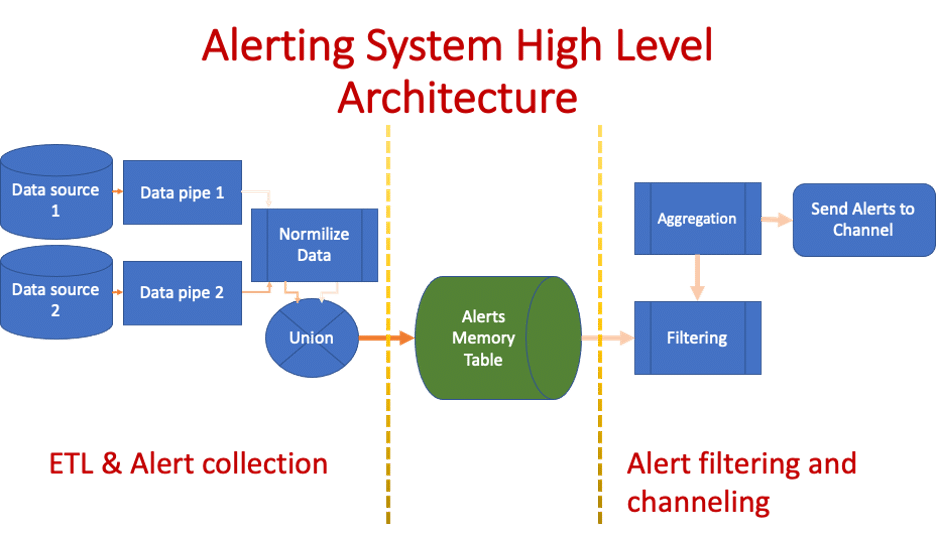
Thus we arrived at the current solution, which uses a series of multiple views that are executed sequentially and in parallel. The high-level idea behind this architecture is that we first split it into two parts:
- The ETL and alert collection part (shown on the left side):
- Retrieving alerts from data sources using pipelines
- Pipelines should be composed of queries of a similar nature (i.e. shared data source and data operations)
- At the end of each pipeline, we ensure that the data is in “standard form” and contains the same structure
- Uniting the data from all pipelines and saving it into the memory table
- Retrieving alerts from data sources using pipelines
- Alert filtering and allocating alerts to channels:
- We retrieve the relevant alert data and perform filters as necessary (e.g. filtering out old alerts based on time)
- Aggregation of alerts per message
- Sending the results of the aggregations to the relevant views with a handler to the necessary channel
Note: While the diagram above shows only a single flow to a single channel, you can actually create many such flows to multiple channels.
The breaking up of the process into two parts with a table in the middle makes this much easier to debug and track. It also makes it possible to run the two parts at different times or frequencies.
Overall, the architecture is the result of all the pain points we experienced during the previous iteration after observing how the alert system was being used and the future-proofing it needed. Except for the Data Sources and the Alerts Memory Table (which is a Snowflake Table), every other object in the architecture is a Snowflake view.
Why This Solves Numerous Problems
Why does this more complex architecture help? Because it upholds several key concepts:
Encapsulation
Creating a series of views means that we can run and debug every section independently. This saves time when debugging but also makes things cleaner and easier to update. It’s a concept that works well in object-oriented programming languages and it applies here as well.
Standardization
While you can make the logic as complex as you want, the data at the end of all pipelines must contain the exact same structure. This makes it possible to join various pipelines using different levels of complex logic into one coherent pipeline.
Parallelization
Using a combination of sequential and parallel views (which are all subqueries), we gain the benefit of parallelization. Since the different pipelines are completely independent until the union between them is performed, Snowflake can run each pipeline as a sequence of parallel subqueries. By making each pipeline composed of alerts that need the same type of operations (e.g. aggregation by user), we can perform multiple detections in the same pass over the data — just like in the previous implementation but more focused). This helps improve performance.
Automation
Using a combination of scheduled tasks, UDFs, and procedures that are integrated into the Snowflake database, we can automate the entire process to detect changes and adapt. New alerts added to the process in the pipelines are detected in the upper levels, so no updates are required beyond the pipeline level.
Process Independence
Adding alerts does not require changing views outside of those alerts’ pipelines. And adding more channels or changing filters or aggregations for alerts does not require changes to the pipelines either.
How This Is Implemented in Snowflake
Encapsulation & Parallelization
These are implemented by using multiple pipelines of sequential views, specifically breaking down each pipeline into multiple views with each view representing a logical step in the pipeline. The union of all these pipelines is another view, and calling from that view will make Snowflake execute all the underlying pipelines as subqueries in parallel.
Process Independence
This is attained first by making the Alerts Memory Table an actual table and not a view. It collects alerts over time that we can use to see statistics. Most importantly, making it a table means it is stored, which in turn means we can build multiple processes on top of it (e.g. for multiple channels requiring various levels of aggregations and/or filtering).
Standardization
Each pipeline must end with the data having a standard structure. This ensures that we have a single alert type per customer and date in each row, which makes adding more alert types straightforward since we don’t have to change the schema and add additional columns; we can simply add more rows that contain the information about the new alerts but with the same schema as previous alerts.
Also, since all pipelines must abide by this standard, they can be unified by simply using a UNION ALL between them. To get to this form in each pipeline, we first aggregate the data to get a column for each alert. Then we apply an UNPIVOT to the view to get it to its standard form.
Automation
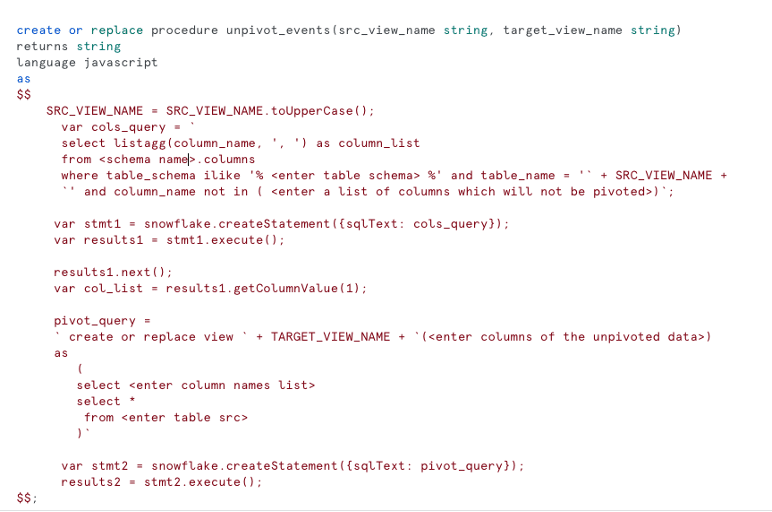
Since we don’t want to worry about having to update schemas or ensuring new alerts are propagating upwards, we automate the process to detect new alerts. This is done via the unpivot process, which converts the alerts from columns to rows.
Because dynamic unpivot (over a dynamic set of columns) is not natively supported in SQL, I used Snowflake’s procedure and scheduled tasks to apply this automation. The procedure unpivots a view on the list of alert columns and creates the unpivot view. The scheduled task calls the creation of the procedure for every view needing the unpivot to detect if a new alert has been added. Thus new alerts added are turned into rows automatically.
How Everything Is Performing
I am happy to report that, thus far, there have been vast improvements — not only in performance (which seems to be more than 10X faster using the same computing power) and lower running costs but also because using the system is more comfortable.
Since the launch of this new iteration, I have added new alerts with much more complex logic. So far, this has been a much better experience in terms of faster debugging and testing as well as implementing changes. Adding a new alert is now a matter of writing a simple SQL query and making sure the pipeline updates at key places. Everything can be done – including testing – in less than half an hour. As for the rest, I no longer have to worry about it.
")